Thursday, August 11, 2016

OTDR Set-Up - Index of Refraction


Picture
All OTDRs regardless of brand have four basic setup requirement i.e. the OTDR user is required to key in these four basic data parameters into OTDR in order to get good and accurate fiber trace analysis.

The required data parameters are :-

  1. Testing Range - Refer to Article HERE
  2. Pulse Width - Refer to Article HERE
  3. Index of Refraction 
  4. Averaging Time
Index of Refraction
Picture
The relationship between distance and velocity or speed is as shown below -
You can review previous article on Index of Refraction HERE or HERE

As previously mentioned index of refraction measures the speed of light in optical medium. It is a function of velocity of light in vacuum and velocity of light in the opticel fiber medium or simply stated as below -
Picture
Velocity of light in fiber optics can be further expressed in terms of velocity of light in vacuum and index of refraction. This is done by rearranging the index of refraction equation as stated above.
Picture
Knowing that C or velocity of light in vacuum is a constant value
Picture
Then the distance of fiber optics as measured by OTDR can be simplied as shown below
Picture
The index of refraction, n,  is a known value which can be obtained from the fiber optics manufacturer. While t , OTDR pulse width  and its backscatter light travelling time , can be measured by OTDR automatically ie. the initial time laser pulse width launched into fiber optics and time taken by backscattered light returned back into OTDR.

Therefore, the measured of fiber optics distance is a function of index of refraction.
As value of IOR increases the measured fiber optic distance or length is getting shorter.
Picture
As value of IOR decreases the measured fiber optic distance or length is getting longer.
Picture
If the OTDR index of refraction does not match to that of fiber optics under testing IOR then the OTDR distance traces might show the incorrect results.

If the fiber optics under testing IOR is not known, then the end-user can use the OTDR default  IOR setting.

Typical fiber optics IOR value is between 1.4000 to 1.6000

Picture
Rule of Thumb
Always obtain the fiber optics Index of Refraction values from corresponding fiber optics manufacturer.

Sunday, August 7, 2016

OTDR Set-Up - Testing Range


Picture
All OTDRs regardless of brand have four basic setup requirement i.e. the OTDR user is required to key in these four basic data parameters into OTDR in order to get good and accurate fiber trace analysis.

The required data parameters are :-

  1. Testing Range 
  2. Pulse Width - Refer Article HERE
  3. Index of Refraction - Refer Article HERE
  4. Averaging Time - Refer Article HERE
Fiber Optics Testing Range or Distance of Fiber Optics to Test
Many OTDRs have automatic length detection functions unless the end-user knows the approximate fiber distance then testing range can be set manually.
The following diagrams provide OTDR traces in accordance to OTDR testing range settings.
Too Short Testing Range

Picture
  • Assuming the fiber optics approximate distance is 1000 meter. 
  • The OTDR testing range is set to 500 meter .
  • The OTDR image / tracse  only show half of the distance thus provide inaccurate testing results.

Too Long Distance Range
Picture
  • Assuming the fiber optics approximate distance is 1000 meter. 
  • The OTDR testing range is set to 5000 meter .
  • The OTDR image / trace shown is compressed into a scale of 1:5 thus giving smaller OTDR traces which can lead into inaccurate measured values.

Good Distance Range
  • Assuming the fiber optics approximate distance is 1000 meter. 
  • The OTDR testing range is set to 1500 meter - 2000 meter .
  • The OTDR image / traces shown is a good OTDR chart thus measured values.
Picture

Picture
Rule of Thumb
The OTDR Testing Range must always be at least 25% greater than fiber optics under testing.

Friday, August 5, 2016

OTDR Setting UP - Pulse Width

Picture
All OTDRs regardless of brand have four basic setup requirement i.e. the OTDR user is required to key in these four basic data parameters into OTDR in order to get good and accurate fiber trace analysis.

The required data parameters are :-
  1. Testing Range 
  2. Pulse Width
  3. Index of Refraction 
  4. Averaging Time 
What is Pulse Width?
Picture
  • OTDR pulse width determines length of fiber that can be measured before OTDR traces become noise.
  • Larger pulse width provides larger dynamic range 
  • Narrow pulse width provides reduced dynamic range. 
  • Dynamice range is associated with pulse width and in turn describes length of fiber that can be measured by OTDRs.
Picture
  • Always start testing with a shorter pulse width. 
  • The shorter pulse width is useful for locating any faults that may otherwise be hidden in longer pulse width.
  • A gradual increase in pulse width is necessary to prevent two or more faults from overlapping.

Picture
Rule of Thumb
Long pulse width for longer fiber distance.
Short pulse width for shorter fiber distance.
Always start with shorter pulse width and gradually increase the pulse width to detect all possible fault traces.

Thursday, August 4, 2016

OTDR Set-up - Averaging


Picture
All OTDRs regardless of brand have four basic setup requirement i.e. the OTDR user is required to key in these four basic data parameters into OTDR in order to get good and accurate fiber trace analysis.

The required data parameters are :-
  1. Testing Range - Refer Article Coming Soon
  2. Pulse Width - Refer Article Coming Soon
  3. Index of Refraction - Refer Article Coming Soon
  4. Averaging Time
What is Averaging ?
Averaging refers to time taken to have a good OTDR traces as shown below.

Picture
Picture
However, the longer averaging time would provide better OTDR traces but it wil be time consuming for OTDR to provide such traces.

The before averaging  or low averaging is sufficient should the end-user only interested to find out the approximate fiber optics link distance.
Picture
The about right averaging is able to provide good measurement loss.
Picture
The higher averaging time provides better OTDR traces but OTDR takes extra times to do the averaging and display better traces.
Picture
Picture
The end-user is required to set the averaging time in order to get good  test measurement results

Wednesday, August 3, 2016

Transmitter, Receiver, Transceiver


Fiber Optics Network
Picture

Transmitter
A network device that convert incoming electrical signal into optical signal for transmisson down an optical fiber link.
Picture
Data, voice and video are digitized and converted into electrical signals which pass through Fiber Optics Transmitter and converts electrical signals into an optical signal output.

Receiver
A network device that converts an incoming optical singal into an electrical signal for transmission down an electrical link.
Picture
Optical signal which pass through Fiber Optics Receiver converts optical signals into an electrical  signal output.

Transceiver
Transceiver is a combination of both fiber optics transmitter and receivers into one component. 
It is commonly called Small Form Factor Pluggable Transceiver or SFP.
Picture

Tuesday, August 2, 2016

Mechanical Splicing


Almost perfect fiber optics single mode mechanical splicing
Picture
Larger photo of mechanical splicing
Picture

OTDR with different settings of Pulse Width


At Pulse Width 3ns
Picture

At Pulse Width 20ns
Picture

At Pulse Width of 100ns 
Picture

At Pulse Width 1micronsecond
Picture

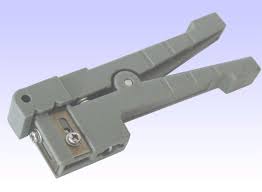
Tube Cutter

Tube Cutter

OTDR Ghost


What is OTDR Ghost?

In the change from glass to air, energy reflected back to the OTDR is of such intensity that the light pulse is reflected off of the connector at the OTDR and is again returned a second time. As the OTDR converts the travel time of the light pulse into distance, the reflective event is painted on the screen a second time—thus, a ghost. - Charles Lohrma

Monday, August 1, 2016

Fiber Optics vs Copper in Commercial Aircraft


Read HERE for details

Multimode Fiber Optics OM1, OM2, OM3, OM4


Multimode fibers are identified by the OM (“optical mode”) designation as outlined in the ISO/IEC 11801 standard.
OM1 cable typically comes with an orange jacket and has a core size of 62.5 micrometers (µm). It can support 10 Gigabit Ethernet at lengths up 33 meters. It is most commonly used for 100 Megabit Ethernet applications.
OM2 also has a suggested jacket color of orange. Its core size is 50µm instead of 62.5µm. It supports 10 Gigabit Ethernet at lengths up to 82 meters but is more commonly used for 1 Gigabit Ethernet applications.
OM3 has a suggested jacket color of aqua. Like OM2, its core size is 50µm. OM3 supports 10 Gigabit Ethernet at lengths up to 300 meters. Besides OM3 is able to support 40 Gigabit and 100 Gigabit Ethernet up to 100 meters. 10 Gigabit Ethernet is its most common use.
OM4 also has a suggested jacket color of aqua. It is a further improvement to OM3. It also uses a 50µm core but it supports 10 Gigabit Ethernet at lengths up 550 meters and it supports 100 Gigabit Ethernet at lengths up to 150 meters.

OM identified by colors

OM4 is Erika Violet color
OM3 is Aqua color

Obsolete Fiber Optics Connectors.. Can you identify them?


Connector 1


Connector 2


Connector 3


Connector 4

Man vs Nature : Which is your cable worst enemy?

Man VS Nature : Which is your cable worst enemy?

Read more HERE

Fiber-To-The-Antenna

Fiber-To-The-Antenna